The Buildout · Part 15Markets and rates
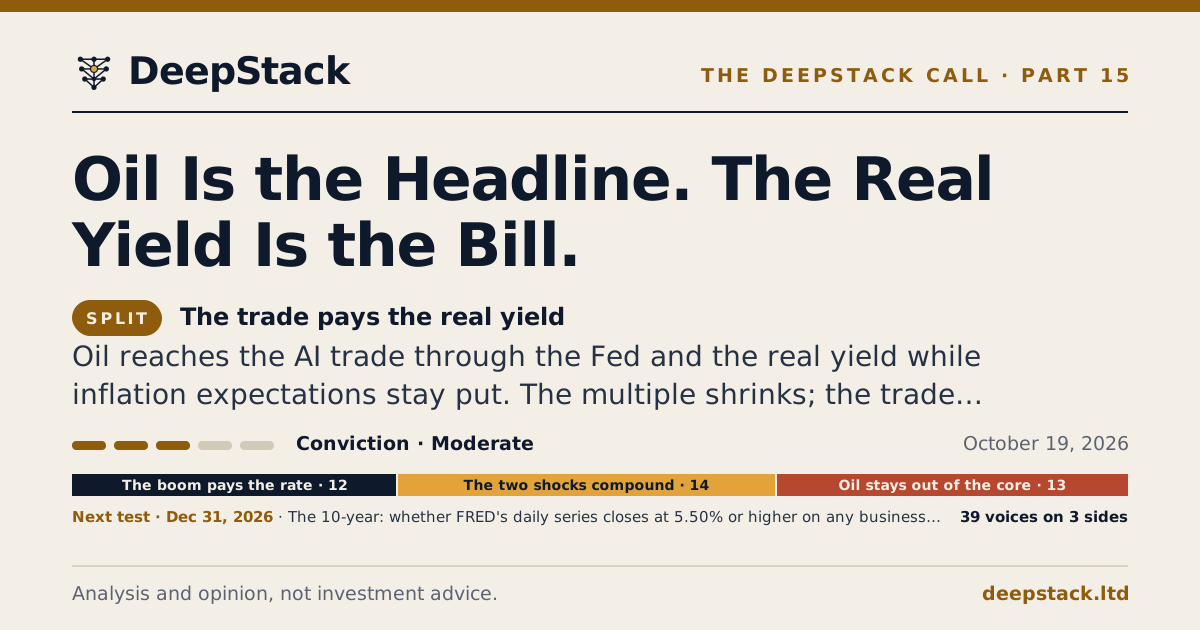
Oil Is the Headline. The Real Yield Is the Bill.
From February 27 to October 8, 2026, the 10-year Treasury yield rose 125 basis points, 115 of them real yield, while breakeven inflation rose 10, by DeepStack's reading of FRED. Retail diesel set a record in the week of September 21, 71% above the week of February 23, by the EIA's survey. The oil shock reaches the AI trade through the Fed and the real yield.

Where this Part stands
- The Call
SplitThe trade pays the real yield.
Oil reaches the AI trade through the Fed and the real yield while inflation expectations stay put. The multiple shrinks; the trade survives.
Conviction Moderate · 3 of 5
- The next test
What is established, and what remains uncertain
- What is established
- From February 27 to October 8, 2026, the 10-year Treasury yield rose 125 basis points: 115 of them real yield and 10 breakeven inflation (FRED DGS10, DFII10 and T10YIE; DeepStack calculation).
- The 10-year closed at 5.31% on October 5, 2026, its highest close since May 2002, after the Fed raised its target range to 3.75% to 4.00% on September 16 (FRED DGS10 and DFEDTARU).
- Retail diesel set a record of $6.529 a gallon in the week of September 21, 2026, 71% above the week of February 23, and the EIA's October 6 outlook put Brent at $105 a barrel for the fourth quarter (EIA).
- What remains uncertain
- Whether the 10-year closes at 5.50% or higher by December 31, 2026, where Howell puts the economy's brake (test p15-t01).
- Whether the oil shock reaches inflation expectations: Brent's fourth-quarter average against $105 (test p15-t02) and the 5-year, 5-year forward rate in March 2027 against 2.60% (test p15-t03).
- Whether the multiple shrinks without breaking the trade: a 10% fall in the C Fund by March 31, 2027 (test p15-t04).
What is established and what remains uncertain: approved by Marco Cauduro on October 12, 2026.
Explain the mechanism Inspect the evidence Read the countercase See the test
On September 27, Michael Howell of Capital Wars wrote that history shows the real economy turning fragile as long-term rates approach 5.5%, so the next large move in Treasury yields may be down. The next day Michael Burry wrote that rates are rising on inflation and on new debt competing with Treasuries, hyperscalerOne of the largest cloud and platform companies that build data centers at continental scale. More → borrowing among it, and that higher rates can make the chain financing the AI buildout come apart. The two readings contradict each other directly. Howell reads a 10-year yield above 5% as a growth cycle near its brake, and Burry as a cost the AI buildout's own borrowing helps raise.
The 10-year Treasury yield closed at 5.31% on October 5, its highest close since May 2002, and at 5.22% on October 8, by the Federal Reserve's daily series on FRED. It first closed at 5% or more on September 15; the next day the Fed raised its target range to 3.75% to 4.00%. Retail diesel reached a record $6.529 a gallon in the week of September 21, 71% above the $3.809 of the week of February 23, the Energy Information Administration's survey shows. On October 6 the agency's Short-Term Energy Outlook raised its forecast for Brent crude in the fourth quarter of 2026 to an average of $105 a barrel, $14 above the month before. Part fifteen asks whether the AI trade can survive a 10-year Treasury above 5% and an oil shock at the same time.
DeepStack read 167 posts, fund letters and episodes by 59 voices, published from July 15 to October 11, 2026, and verified 152 agreements and 171 disagreements, 64 of them direct contradictions and five refutations. Part seven asked who sets the long end, Part ten whether stocks are cheap against it and Part thirteen who pays the power bill. This Part asks by which channel the barrel reaches the AI multiple.
The boom pays the rate
The first reading holds that a 10-year above 5% is what growth costs, and that the boom can pay it. Howell argued on August 23 that long yields are rising because nominal growth has accelerated on a federal deficit near 6% of GDP and a large wave of AI capital spendingCash a company spends on long-lived assets: data centers, chips, networks, power. More →. On September 11 he counted term premia up 29 basis pointsOne hundredth of a percentage point: 25 basis points is 0.25%. More → since late June, against 51 for expected policy rates. Kris of Potential Multibaggers did the arithmetic on September 21: rate hikes do no harm while the economy and profits outgrow the rate, and an estimated 5.1% growth in third-quarter GDP plus inflation puts nominal growth above 8%.
Matthew C. Klein of The Overshoot wrote on September 1 that long yields are still low against reasonable expectations for inflation and growth. Ren found the side's evidence in the shares on October 5: the multiple on semiconductor stocks kept shrinking while their earnings kept growing, because the worry came from oil, yields, the Fed and the war.
Torsten Slok of Apollo answered on September 26 that more than a strong economy is lifting rates, with sticky inflation at the front end, record hyperscaler debt sales in the belly and fiscal worry at the long end. DeepStack found his account and Howell's count in direct contradiction. Howell carries his own limit. On September 18 he wrote that with higher oil, rising yields could begin to bite into growth, with the cycle perhaps 50 basis points from a major peak in the 10-year.
The two shocks compound
The second reading says oil and the long yield feed each other until equities give way. TSCS wrote on September 16 that both keep rising until stocks fall, because the S&P 500 is the only release valve the Treasury's buybacks leave open. Steve Eisman wrote on October 9 that only oil and the 10-year matter to the market day to day. He tied the 10-year's climb during the quarter, from 4.5% to over 5.25%, partly to about $500 billion of AI debt issuance crowding out Treasuries and partly to the Fed's September hike.
The inflation runs through core prices. Slok argued on September 23 that diesel sits in the cost of nearly every physical good, so its rise seeps after a delay into core goods and services, a pass-through the Fed cannot wave away as temporary. Krishna Guha, a guest on Eisman's program on October 4, said the Fed can no longer ignore the shocks after more than five years of inflation above its 2% target, dearer oil among the causes, and that with the job market in good shape a hike is defensible.
The borrowing runs through the same bonds. Slok explained on September 12 why it lands at the long end: data centers, power plants, transmission lines and federal deficits all draw on savings for decades. Mia Silverio of Prof G Markets named the cost on October 5: an investor who can earn 5.3% on a Treasury demands more from a stock and pays less for each dollar of its earnings. Daniel Romero of HyperTech Invest recounted on September 21 a stretch in which oil rallied 35% while semiconductor shares fell 30%. On this side, the AI trade is its own counterparty.
Oil stays out of the core
The third reading accepts the shock and doubts the cure. DeepValue Capital wrote on October 1 that rate hikes fight demand-led inflation while today's is supply-led, so no amount of tightening reopens the Strait of Hormuz. DeepStack judged that case a refutation of Guha's. Kris, in the same September 21 post as his growth arithmetic, called pricier oil the likely main reason for higher inflation and wrote that a higher rate will not cure it.
Kira Thornton of Variant Perception wrote on September 14 that core inflation trends remain muted, with Iran and El Niño leaving the energy and food tails beyond policymakers' reach. Howell crosses to this side on oil. On October 9 he wrote that diesel at current prices implies crude above $160 a barrel, short of a recession signal and consistent with a marked slowdown in real growth. DeepStack judged Slok's September 23 pass-through argument a refutation of Thornton's reading: diesel does not stay in the energy line.
Klein supplies the objection. In a September 14 note he wrote that producer prices for core goods and services still rise one to two percentage points faster than in the years before the pandemic, and that data from before the war with Iran contradict the claim that the war caused the excess. DeepStack judged the producer-price reading a refutation of DeepValue's September 18 case that hikes cannot cure an inflation born in the Strait. If the excess predates the barrel, the Fed is answering more than Hormuz, and a ceasefire would not end the hikes.
The bill comes as a real yield
TSCS measured the split on September 21: from the February 27 low the 10-year had risen 104 basis points, 96 of them real yieldThe yield on a Treasury whose principal rises with inflation: the price of money after inflation. More → and 8 breakeven inflation. Oil explains the daily wiggles in yields but not the trend, the post found: Brent was cheaper than at its spring peak while the 10-year stood 70 basis points higher, though since the war each $10 move in Brent had come with about 5 basis points on the 10-year. Romero wrote the same day that oil, consumer prices and yields move together, so rising oil forces the Fed's hand. DeepStack judged TSCS's split a qualification of Romero's link: the oil-to-yield channel runs through the real yield, not through inflation expectations. DeepStack re-ran the split on FRED on October 12, 2026.
- 10-year Treasury125
- 10-year real yield115
- 10-year breakeven10
- 5-year, 5-year forward22
Source: FRED series DGS10, DFII10, T10YIE and T5YIFR, read Oct 12, 2026; DeepStack calculation
From February 27 to October 8, 2026, the 10-year rose 125 basis points, from 3.97% to 5.22%. The 10-year real yield, read from Treasury inflation-protected securities, rose 115, from 1.72% to 2.87%, and closed at 2.95% on October 5, its highest since November 2008. Breakeven inflation, the market's ten-year inflation guess, rose 10, from 2.25% to 2.35%. The 5-year, 5-year forward rate, a gauge of the inflation expected five to ten years out, rose 22 to 2.32% on October 9. TSCS set the bar for the breakeven on September 16: cheap against realized inflation, and no bargain against its own two-year range of 2.18% to 2.46% at month-ends. At 2.35% on October 8 it sits inside that range, which narrows Slok's reading of record diesel crack spreadsThe extra yield a borrower pays above a Treasury of the same maturity, in basis points. More → and rising yields as a bond market pricing a broader inflation shock.
Howell wrote on September 18 that the rise came mainly from expected short rates, with term premia arguably falling; Hugh Vuillier of Variant Perception had written on September 6 that the real term premium drove it. The two contradict each other. The Fed staff's Kim-Wright model splits the difference by date: its term premium rose 26 basis points from June 30 to September 11, close to Howell's 29, and 62 from February 27 to October 2, nearly half of the 10-year's 131-point rise over those dates. TSCS cautioned on September 21 that the Fed's three models disagree about this year's leg. Michael W. Green of Yes, I Give a Fig wrote on August 23 that the structural buyers of long Treasuries have been withdrawing in stages for years, from Japan's hedged investors to corporate pensions. In the release-valve post of September 16, TSCS added that the buyers who once closed the gap, Japanese life insurers and U.S. insurers, have arithmetic reasons not to. The premium is what investors charge to hold durationHow far in the future a payment or a return sits, and how sensitive its value is to interest rates. More → while the Treasury and the hyperscalers sell it and, by Green's account, the old buyers step away.
DeepStack's reading is that the barrel helped move the Fed, landing on core prices that ran hot before the war, and that the Fed and the borrowers moved the real yield. Slok wrote on October 6 that a deal lowering oil would ease the pressure on rates, with 84% of global fixed income yielding more than 3%. If oil falls while the issuance continues, the real yield can hold, and a trade valued on earnings years away pays that rate. Howell's August 14 projection puts a 5.5% yield beside a market multiple below 20 times, about 10% lower, and Vitaliy Katsenelson named the likely casualties on September 10: expensive stocks whose cash flows lie far in the future.
Burry's warning concerns the lenders, and the first reading's own author shares the worry. Howell wrote on August 26 that if bond yields keep rising, the business of refinancing debt will groan under the strain, and that the creaking he hears now is literal. Part eight followed the loans behind the buildout. DeepStack's answer is that the damage so far shows in the price of the shares, in the shrinking multiple Ren found on October 5. The financing has held: by Slok's count on September 26, hyperscaler debt sales were running at a record. That answer fails if a hyperscaler cuts its capital-spending guidance or one of its long bond sales draws weak demand, and Alphabet and Microsoft report on October 28.
The barrel gave the Fed one more reason to hike. The trade's own borrowing helped lift the real yield, and that is the yield its multiple answers to.
The tests ahead
The first result arrives on October 28. The Fed's decision, on its calendar, settles the test Part seven placed on the Docket, where DeepStack put the chance of a hike at 40 in 100. Alphabet reports that afternoon and Microsoft after the close. Third-quarter GDP and September's consumption prices follow on October 29, on the BEA's schedule, a check on Kris's nominal growth above 8%. October's consumer prices arrive on November 10, on the Bureau of Labor Statistics schedule, with the EIA's next outlook. Core goods would show Slok's diesel first.
DeepStack sets four dated tests, each read from a public source. Does the 10-year close at 5.50% or higher on any business day from October 16 through December 31, 2026? Does the EIA's outlook of January 12, 2027 put the fourth quarter's Brent average above the $105 it forecast on October 6, 2026? Does the 5-year, 5-year forward rate average above 2.60% in March 2027? Does the C Fund of the Thrift Savings Plan, the federal employees' S&P 500 index fund, close 10% or more below its highest close since October 16, 2026, on any business day through March 31, 2027, by its share price history?
DeepStack puts 35 on a 10-year close at 5.50% or higher by December 31, 2026, because Howell's brake sits there and Slok warned on August 29 that long rates six months on could be far lower. It puts 60 on Brent finishing the fourth quarter above the agency's $105, since the October 6 outlook raised that forecast $14 in one month and still describes extreme tightness in diesel. It puts 15 on the forward rate averaging above 2.60% in March 2027, and 40 on a 10% fall in the C Fund by March 31, 2027.
Two results would move the house to the second reading: a 10-year close at 5.50% or higher with breakeven inflation under its May 4 high of 2.50%, which would put the real yield past Howell's brake, or a forward rate above 2.60%. A Fed that holds on October 28 and a real yield back under 2.50% by the December 9 decision would mean the boom is paying the rate.
The AI trade is already paying for both shocks through one rate. The barrel gave the Fed one more reason to hike. The trade's own borrowing helped lift the real yield, and that is the yield its multiple answers to.
Run the numbers
The figures in this story, built into a chart you can test for yourself.
Data Desk · Live · Part 15Markets
Nearly all of the climb is real yield
The 10-year Treasury's move since the late-February low, split into the real yield and the inflation the market prices, from the daily closes. Count from another date and see whether the split holds.
As of Oct 19, 2026 · daily closes, at each build · published Oct 19, 2026 · read Oct 21, 2026 · observed · next release the next weekday build
Live data, updated Oct 21, 2026, 6:30 a.m. ET
Count the move from
10-year Treasury+118 bp
Real yield+108 bp
Breakeven inflation+10 bp
The +118 bp move from Feb 27, 2026 to Oct 19, 2026, by part
Real yieldBreakeven inflation
10-year TreasuryReal yield
From Feb 27, 2026 to Oct 19, 2026, the 10-year Treasury moved +118 bp: +108 bp from the real yield and +10 bp from expected inflation. That is the market charging more for money, not pricing more inflation.
The DeepStack call
SplitThe trade pays the real yield
Oil reaches the AI trade through the Fed and the real yield while inflation expectations stay put. The multiple shrinks; the trade survives.
What to do with this
- Split every move in the 10-year into real yield and breakeven: from Feb 27 to Oct 8, 2026, 115 of its 125 basis points were real.
- Price long-dated earnings against a 10-year at 5.5%, where Howell's Aug 14 projection put the market multiple below 20 times.
- Count AI borrowing as a rates input: Eisman tied about $500 billion of AI debt issuance to the 10-year's climb on Oct 9.
What would change our mind
- The 10-year closes at 5.50% or higher with breakeven inflation under its May 4 high of 2.50%: the two shocks compound.
- The 5-year, 5-year forward rate on FRED closes above 2.60%: the shock has reached inflation expectations.
- The Fed holds on October 28 and the real yield closes under 2.50% by December 9: the boom is paying the rate.
Next test
All 4 testsRead the full argument
DeepStack's view is that the AI trade survives the barrel and pays for it through the real yield. From February 27 to October 8, 2026, the 10-year Treasury yield rose 125 basis points, 115 of them real yield and 10 breakeven inflation, by DeepStack's reading of FRED; retail diesel rose 71% from the week of February 23 to a record in the week of September 21, by the EIA's survey. The barrel landed on core prices already running hot before the war and gave the Fed one more reason to raise its target range, which it did on September 16; the Fed and the borrowing of the Treasury and the hyperscalers moved the real yield, the rate long-dated earnings answer to. The single most important reason for caution is the core: if diesel reaches core prices, as Torsten Slok of Apollo argued on September 23, expectations follow and the two shocks compound. The view changes if the 10-year closes at 5.50% or higher with breakeven inflation under 2.50%, or if the 5-year, 5-year forward rate averages above 2.60% in March 2027. The first result arrives on October 28, when the Fed decides.
Call history
- v2The trade pays the real yieldConviction Moderate (3/5)SynthesisSide named by the owner.
- v1The trade pays the real yieldConviction Moderate (3/5)First call, with the story.
The numbers behind the Call5.31%+115 bp+10 bp$105
Analysis and opinion, not investment advice.
What to watch
The 10-year: whether FRED's daily series closes at 5.50% or higher on any business day from October 16 through December 31, 2026, after a 5.31% high on October 5. Pre-specified
- Question
- Does the 10-year Treasury constant-maturity yield (FRED series DGS10) close at 5.50% or higher on any day from October 16, 2026 through December 31, 2026 for which FRED reports a value?
- Source
- FRED, Market Yield on U.S. Treasury Securities at 10-Year Constant Maturity (DGS10), Board of Governors of the Federal Reserve System
- Rule
- Read every daily observation of DGS10 dated October 16, 2026 through December 31, 2026, as FRED shows them on January 5, 2027; the days read are the days for which FRED reports a value. The answer is yes if any of them is 5.50 or higher; no if every one is below 5.50. Intraday highs, other maturities and yields reported in the press are read alongside and do not decide the test.
- If the source is late, revised or silent
- FRED posts each close about one business day later, so the observation for December 31, 2026 is due by January 4, 2027. A weekday FRED leaves blank because the U.S. bond market was closed is not missing and is not read: in this window, Veterans Day (November 11), Thanksgiving (November 26) and Christmas (December 25, 2026), by the holiday schedule of the Securities Industry and Financial Markets Association. Only a weekday on which the bond market was open and FRED still shows no value on January 8, 2027 is missing; if one is, and no observation already in is 5.50 or higher, the test is inconclusive, and the Result says what was read and what was missing; the next reading is January 15, 2027. A close FRED revises before the reading is read as revised; a later revision does not reopen the test.
The Call, before the dateExpects no. Gives the yes answer 35%.
0 · no100 · yes
The machinesClaude 26% · DeepSeek 30% · GPT 42%
Your numberSign in by email to forecast
The barrel: whether the EIA's January outlook puts Brent's fourth-quarter 2026 average above the $105 a barrel it forecast on October 6, 2026. Pre-specified
- Question
- Does the U.S. Energy Information Administration's Short-Term Energy Outlook of January 2027 put the average Brent crude oil spot price for the fourth quarter of 2026 above $105 a barrel?
- Source
- U.S. Energy Information Administration, Short-Term Energy Outlook, January 2027 release (energy prices table, quarterly Brent spot average), scheduled for January 12, 2027
- Rule
- Read the fourth-quarter 2026 Brent spot average, in dollars per barrel, from the energy prices table of the January 2027 Short-Term Energy Outlook, where the quarter is history. The answer is yes if it is above $105.00; no if it is $105.00 or below. The outlook's forecasts for 2027, futures prices and prices reported in the press are read alongside and do not decide the test.
- If the source is late, revised or silent
- The EIA schedules the January outlook for January 12, 2027. If it is not published by January 19, 2027, or its energy prices table does not give the fourth quarter of 2026, the test is inconclusive, and the Result says what was read and what was missing; the next reading is the February outlook, scheduled for February 9, 2027, which also carries the quarter as history. Figures are read as first published in the release read.
The Call, before the dateExpects yes. Gives the yes answer 60%.
0 · no100 · yes
The machinesClaude 48% · DeepSeek 70% · GPT 60%
Your numberSign in by email to forecast
Expectations: whether FRED's 5-year, 5-year forward inflation rate averages above 2.60% in March 2027, from 2.32% on October 9, 2026. Pre-specified
- Question
- Does the 5-year, 5-year forward inflation expectation rate (FRED series T5YIFR) average more than 2.60% over the days of March 2027 for which FRED reports a value?
- Source
- FRED, 5-Year, 5-Year Forward Inflation Expectation Rate (T5YIFR), Federal Reserve Bank of St. Louis
- Rule
- Average the daily observations of T5YIFR dated March 1 through March 31, 2027 for which FRED reports a value, as FRED shows them on April 1, 2027, rounded to two decimals. The answer is yes if the average is above 2.60; no if it is 2.60 or below. The 10-year breakeven (T10YIE), surveys of inflation expectations and readings outside March are read alongside and do not decide the test.
- If the source is late, revised or silent
- FRED posts the series about one business day later, so the observation for March 31, 2027 is due by April 1, 2027. A weekday FRED leaves blank because the U.S. bond market was closed is not missing and is left out of the average. Good Friday, March 26, 2027, is expected to be such a day: not a federal holiday, but a bond market close on the holiday schedule of the Securities Industry and Financial Markets Association, which FRED left blank in 2024 and 2025; the Result names every weekday left blank and why. Only a weekday of March on which the bond market was open and FRED still shows no value on April 8, 2027 is missing; if one is, the test is inconclusive, and the Result says what was read and what was missing; the next reading is April 15, 2027. Observations FRED revises before the reading are read as revised; a later revision does not reopen the test.
The Call, before the dateExpects no. Gives the yes answer 15%.
0 · no100 · yes
The machinesClaude 13% · DeepSeek 20% · GPT 28%
Your numberSign in by email to forecast
The trade: whether the Thrift Savings Plan's C Fund, an S&P 500 index fund, closes 10% or more below its highest close since October 16, 2026, on any day through March 31, 2027. Pre-specified
- Question
- Does the C Fund of the Thrift Savings Plan, the federal employees' S&P 500 index fund, close at or below 90% of its highest closing share price since October 16, 2026, on any business day from October 16, 2026 through March 31, 2027?
- Source
- Thrift Savings Plan, share price history of the C Fund (daily closing share prices, tsp.gov)
- Rule
- Read the C Fund's daily share prices from October 16, 2026 through March 31, 2027 in the plan's share price history. For each day, take the highest price from October 16, 2026 through that day. The answer is yes if on any day the price is at or below 90% of that running high; no if it never is. The fund holds the stocks of the S&P 500 and reinvests their dividends, so its share price is the record the test reads; the index itself and the plan's other funds are read alongside and do not decide the test.
- If the source is late, revised or silent
- If the plan has not posted the prices through March 31, 2027 by April 7, 2027, the test is inconclusive, and the Result says what was read and what was missing; the next reading is April 14, 2027. A price the plan corrects is read as corrected.
The Call, before the dateExpects no. Gives the yes answer 40%.
0 · no100 · yes
The machinesClaude 40% · DeepSeek 38% · GPT 58%
Your numberSign in by email to forecast
The machines: Each model read this page and nothing else. The number that counts is the latest one each model gave before the test closed.
Follow
Follow Part 15: one email when one of its tests resolves.
Sources and further reading (27)
- Federal Reserve Bank of St. Louis, FRED - 10-year Treasury constant maturity (DGS10)
- FRED - Federal funds target range, upper limit (DFEDTARU)
- U.S. Energy Information Administration via FRED - U.S. No. 2 diesel retail price (GASDESW)
- U.S. Energy Information Administration - Short-Term Energy Outlook, October 6, 2026
- Kris, Potential Multibaggers - The End Of An Era
- Matthew C. Klein, The Overshoot - Rising Bond Yields Are Good, Actually
- Torsten Slok, Apollo - Recent Rates Volatility: Risks and Opportunities in Credit
- Torsten Slok, Apollo - The Diesel Shock Is a Core Inflation Shock
- Torsten Slok, Apollo - From a Savings Glut to a Savings Shortage
- Mia Silverio, Prof G Markets - Americans are turning on AI
- Daniel Romero, HyperTech Invest - The Math Behind the Next AI Rally
- Kira Thornton, Variant Perception - Growth softer, tails wider
- Matthew C. Klein, The Overshoot - Just Waiting for Disinflation is Not Enough
- FRED - 10-year Treasury inflation-indexed yield (DFII10)
- FRED - 10-year breakeven inflation rate (T10YIE)
- FRED - 5-year, 5-year forward inflation expectation rate (T5YIFR)
- Hugh Vuillier, Variant Perception - Politics Trumps Economics: Macro Snapshot
- Michael W. Green, Yes, I Give a Fig - Great, Scott...
- FRED - Term premium on a 10-year zero-coupon bond, Kim-Wright (THREEFYTP10)
- Torsten Slok, Apollo - Are Rates Peaking Within the Next Month?
- Board of Governors of the Federal Reserve System - FOMC meeting calendars
- Alphabet - Date of third quarter 2026 results
- Microsoft - Quarterly earnings release date
- U.S. Bureau of Economic Analysis - Release schedule
- U.S. Bureau of Labor Statistics - Consumer Price Index release schedule
- Thrift Savings Plan - Share price history
- Torsten Slok, Apollo - Think Six Months Ahead
Market data are as of the dates cited.